TikTok Analytics: Know What to Repeat, Fix, or Stop
Use TikTok analytics to compare videos by age, source, and viewer response. Spot false wins, read mixed signals, and choose a better next test.
On this page
What TikTok analytics can tell you
Two TikTok videos can get the same views and need opposite fixes.
What the view count hides
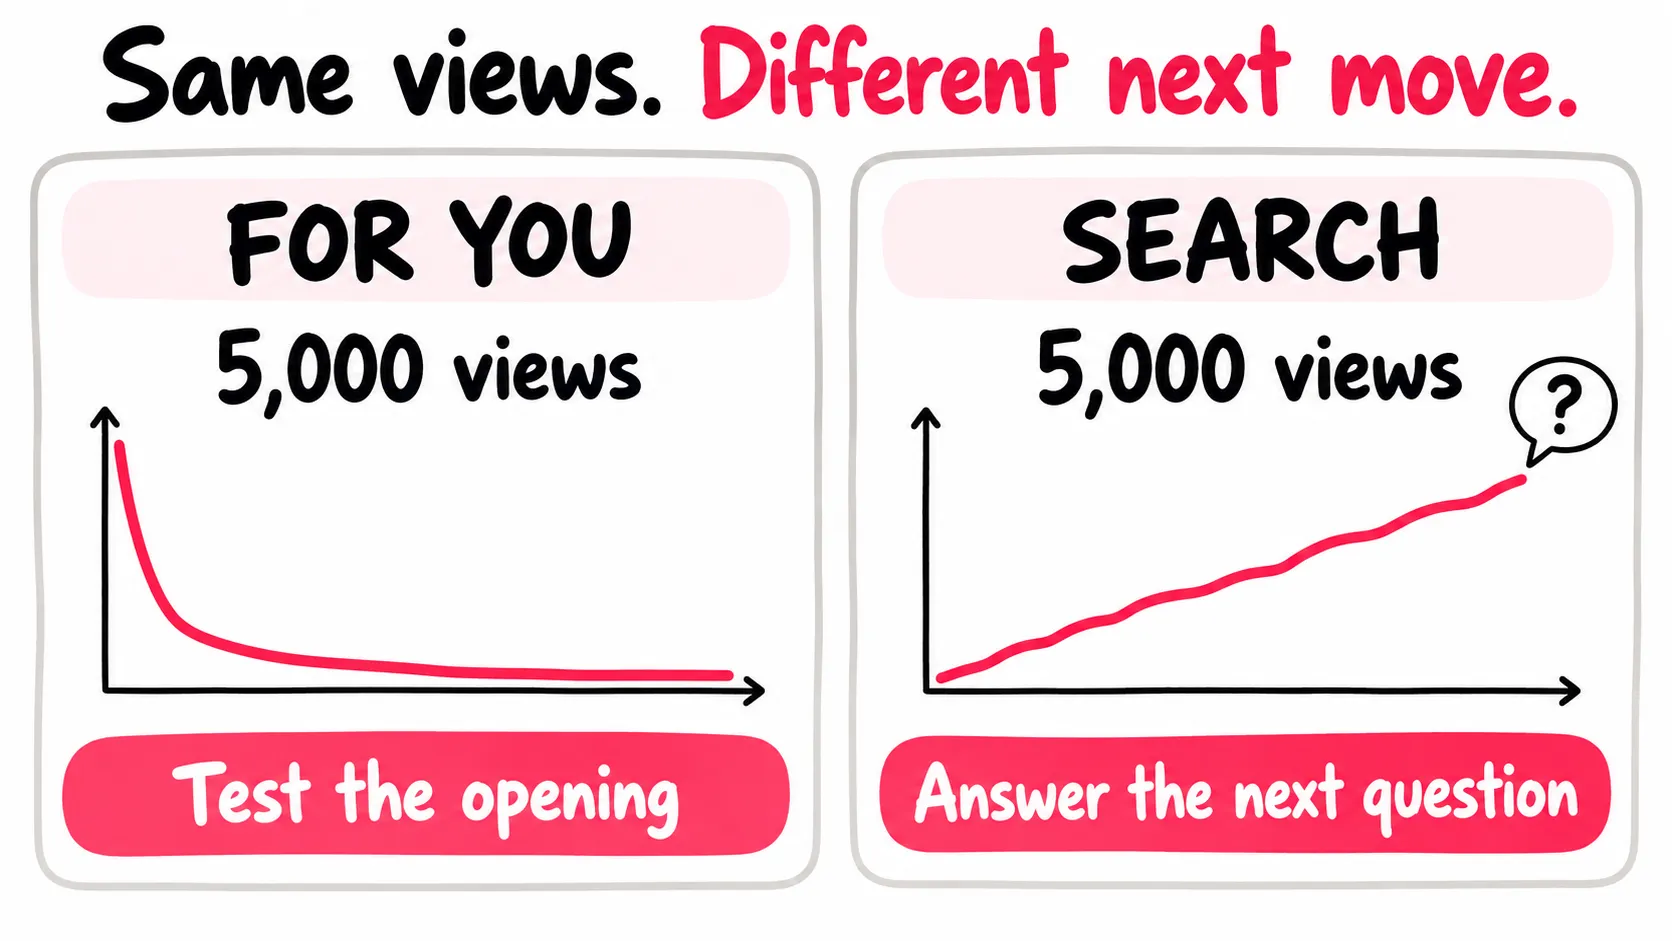
One video gets 5,000 views from For You, then loses most viewers before the point. Another gets 5,000 views from Search over two weeks and leaves you with questions people want answered. The headline number is the same, but the next move is different.
TikTok analytics gives you the clues. The hard part is knowing which comparisons are fair and what the numbers can’t prove.
What You’ll Learn
- Find your own TikTok Studio analytics and the right report for each question.
- Compare posts by age, length, format, and where viewers came from.
- Read watch time, source mix, and response without chasing one magic score.
- Use a short review to decide what to repeat, change, or stop.
- Keep TikTok results separate from public estimates and paid delivery.
Decide what the report must answer
Write your question before you open Studio: “Should I make this format again?” or “Did the new opening help people stay?”
Now choose the numbers that could change your mind. If you cannot say what result would make you repeat or drop the idea, the chart is just a scoreboard.
Where to find TikTok analytics
On your phone:
- Open Profile.
- Tap the menu, then TikTok Studio.
- Tap Analytics. For one video, open it and look for More insights or More data.
On a computer, sign in at TikTok Studio. The larger screen helps when you want to compare several posts. TikTok’s creator tools help page shows both routes.
Can’t find Analytics? Look for Get started and turn it on. TikTok says creator tools work with Personal and Business Accounts. You do not need to switch accounts just because an old blog post says so. Some tools vary by region and device; TikTok’s Studio guide lists the main sections.
If you have a Business Account, you may also see TikTok’s Web Business Suite. Your tabs might not look exactly like a friend’s. Use the names and date ranges you see in your own account.
Pick the screen that fits your question
| Your question | Start here | What to look for |
|---|---|---|
| Is my account growing? | Overview | Views, profile visits, new followers, and dates |
| Which video kept people watching? | Content or that video’s insights | Length, average watch time, full watches, and the watch graph if shown |
| How did people find this video? | That video’s insights | For You, Search, profile, and any other sources shown |
| Who is watching? | Viewers and Followers | Where viewers live and when followers are active |
| How did a live stream go? | LIVE, if you have it | Viewers, time watched, and actions from that stream |
If the Overview shows your account has stopped growing, our TikTok growth audit shows which stage to fix first.
Check the dates above the chart. The count on a public video shows its whole life. An account chart set to the last seven days does not. Those numbers should not match.
Read the four layers of a TikTok post
Open a post’s insights. Read from top to bottom: reach, attention, response, then account result. Each layer narrows the next question. Skipping straight to likes or views makes it easy to fix the wrong thing.
1. Reach: count the views from each source
Traffic sources show where views came from, such as For You, Search, or your profile. A share of the total can hide a gain in real views.
Say Search brought 40% of 1,000 views. That’s 400 search views. On another post, it brought 10% of 20,000. That’s 2,000 search views. The smaller share brought five times as many search views.
Also check when the views came in. A post made for Search may keep gaining views after its For You burst ends. Check it again later before you call it a flop. If you want to plan more search posts, our Creator Search Insights guide covers how to find a question worth answering.
2. Attention: compare watch time with video length
An average watch time of six seconds tells you little on its own. On a nine second video, people saw much of it. On a one minute video, most of the message may still be ahead of them.
If TikTok shows a watch graph, find a sharp drop and play that exact second. What changed on screen? Did the video stop moving, switch to a long setup, or sound like it had ended? Write down what you see in the video. The graph shows where people left, not why.
Compare full watches with videos of similar length. A short clip can have a high full watch rate and still do a poor job for your goal. TikTok says watching, skipping, likes, shares, and other actions can shape recommendations. It does not publish a completion score that guarantees reach. Read TikTok’s guidance on how it recommends content before trusting a magic target.
3. Response: ask what people cared enough to do
Now look at shares, saves, and comments. Read the words, not only the counts. “Where can I buy it?” and “This is funny” are both comments, but they point to different next posts.
Divide actions by views when you compare posts with very different reach. Forty shares on 2,000 views is 20 shares per 1,000 views. Eighty shares on 20,000 views is only four per 1,000. The second post has more total shares. The first got shared more often by the people who watched it. Keep both facts.
Our TikTok engagement rate calculator handles the full rate and its limits. If comments repeat the same question, use that question to plan the next video. TikTok’s comment insights can group those questions where the feature is available.
4. Account result: check what followed the view
If the goal is followers, look at profile views and new follows over the same dates. A rise is useful, but account totals cannot give one post credit for every visit or follow. Other videos, a new bio, and paid reach may have played a part.
For a store or service, ask one more question: did the right people take a step outside TikTok? Studio can show how the post did on TikTok. Your site or sales records hold the rest of the answer. Put those numbers beside Studio’s, with their own dates and labels. Don’t turn a TikTok view into a sale by assumption.
If views bring few follows, our views without followers guide goes deep on the video-to-profile path. If reach has fallen across posts, use the views dropping guide to sort out which kind of drop you have.
What to do when your metrics disagree
Most useful reports have mixed signals. Use this table to choose a check, then a test. It can’t tell you what the algorithm did.
| What you see | Check before you decide | A useful next test |
|---|---|---|
| Views rise, but average watch time falls | Did the new views come from a different source or a broader topic? Compare posts of similar length. | Keep the topic. Make the opening clearer for someone who has never seen you. |
| Watch time looks strong, but views stay low | How long is the video? How many views is the rate based on? Is there a post notice? | Make a second post for the same audience with a different first shot. Judge both at the same age. |
| Shares rise, but few people follow | Are people sharing a one-off joke or answer? What does a new visitor find on your profile? | Make a linked follow-up that gives that viewer a reason to return. |
| Search share rises, but total views fall | Did actual search views rise, or did For You views fall faster? | Keep the search idea only if the number of useful search views grows over time. |
| Profile visits rise, but sales do not | Are the visitors a fit for your offer? Does your profile send them to the right place? | Change one step after the video, then check site or sales data too. |
No row means “post more” or “buy reach” by default. First find the step you can change. A good second test can teach you more than ten new posts made from ten guesses.
Give each post a fair comparison
A two hour old post has had less time to gather views than a three week old post. Obvious, but easy to forget when both counts sit side by side on your profile.
Pick a check point, such as seven days after posting. Save each post’s numbers at that age. Then keep three things as close as you can:
- The job: a product demo belongs beside other demos, not a joke made for broad reach.
- The viewing chance: note the main traffic source and whether you paid to send people to the post.
- The format: compare videos of similar length when you judge watch time or full watches.
You will rarely get a perfect match. Mark the differences so you know what else might explain a result.
Say you make two 20 second home organization videos. Both get most views from For You. Video A opens with a messy closet. Video B opens with the finished shelf, then shows how it was made. At day seven, you record these numbers. They are made up to show the method, not a TikTok benchmark.
| At day seven | Video A | Video B |
|---|---|---|
| Length | 20 seconds | 20 seconds |
| Views | 12,000 | 5,000 |
| Average watch time | 6 seconds | 11 seconds |
| Watched to the end | 18% | 43% |
| Shares | 24 | 58 |
| Main traffic source | For You | For You |
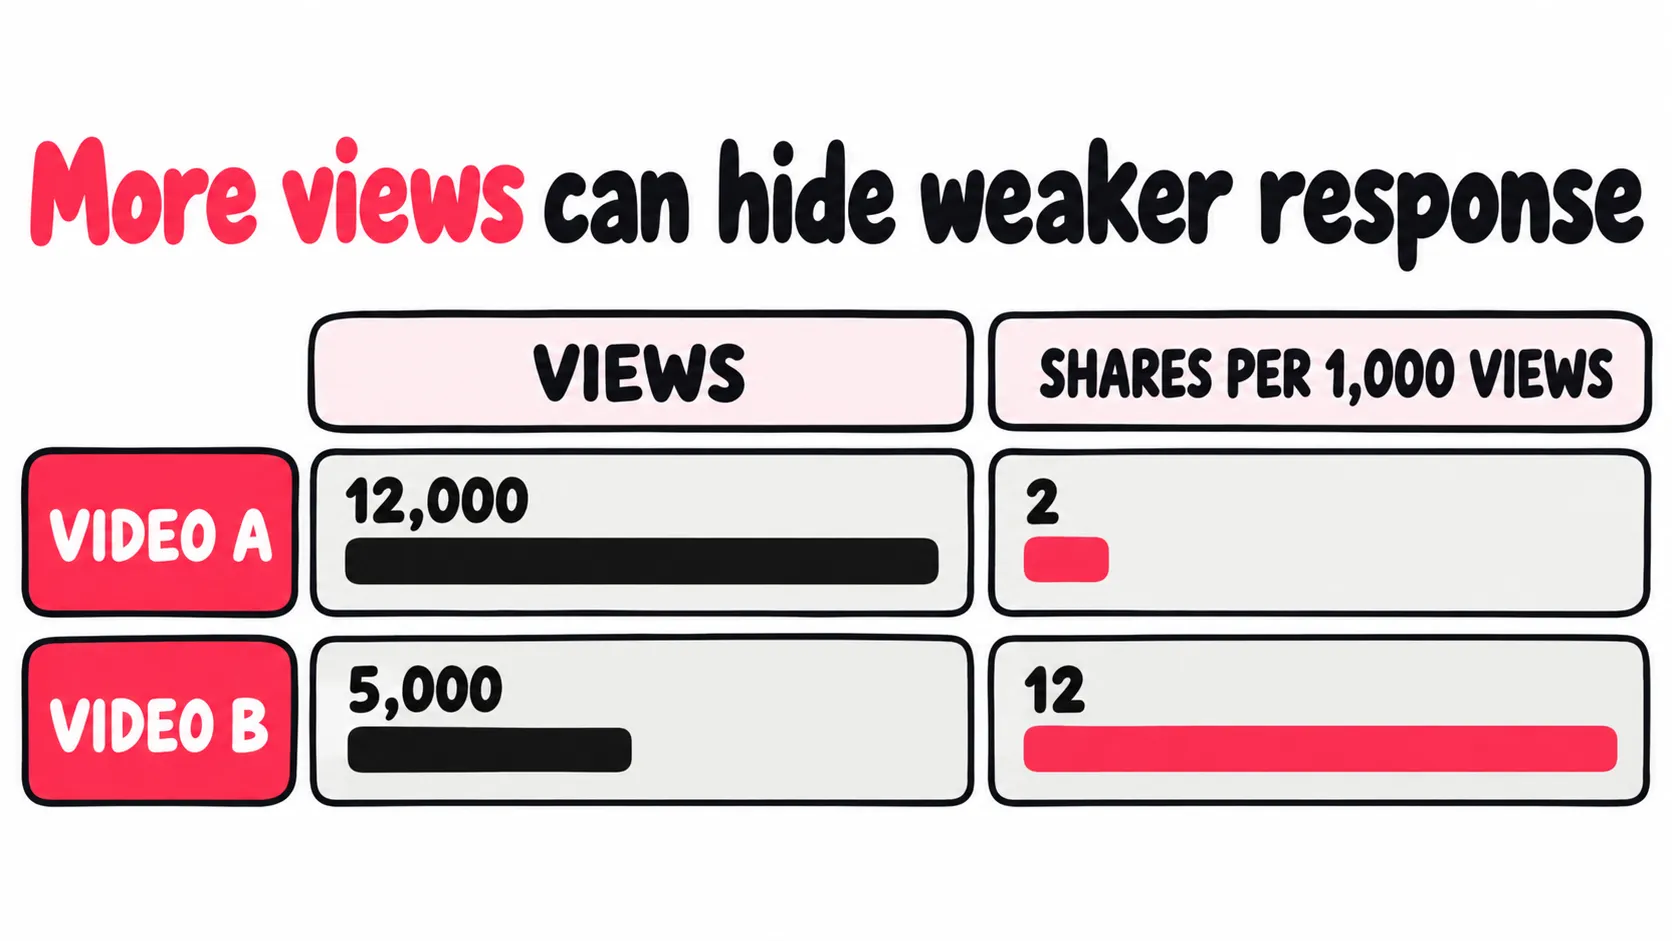
Video A brought more views. Video B held attention longer and got more shares, even with a smaller audience. The gap is clearer when you put shares on the same base: A got 2 shares per 1,000 views. B got about 12.
That doesn’t prove showing the finished shelf first was the winning move. The two videos may have reached different people. B’s subject may have been more useful. But you now have a specific idea to test: show the result first on the next closet tip while keeping the length and audience goal similar. Check it at day seven.
If the new post holds more viewers too, the opening is worth testing again. If it does not, look at B’s topic and comments before you copy its edit. One good post is a lead. Several related posts are a pattern.
One hit can also pull up your average. The middle result from several similar posts often says more about what you can repeat. Our engagement rate guide shows how to find that middle and read the different kinds of response.
Keep the count beside every rate. Four saves from 100 views is 4%. Two saves from 100 views is 2%. The rate doubled, but only two actions separate the posts. With small counts, wait for more views or look at more related posts before you call a winner.
Run a weekly review that ends with a real test
Open the posts that have reached your check point once a week. If only four are old enough, review four. A clean record matters more than hitting a set number of posts.
For each post, save the link, topic, goal, length, publish date, check date, views, main source, watch time, full watches, and key actions. Write “missing” when TikTok leaves a field blank. Zero means something different. A phone note works. So does a sheet.
Then fill out a short test brief. Here is what one could look like after the closet review:
| Question | The answer before filming |
|---|---|
| What might be working? | Showing the finished result before the steps. |
| Which posts can I compare? | Recent 20 second closet tips checked on day seven, with most views from For You. |
| What will I change? | Put the finished shelf in the first shot. Keep the topic type and length close. |
| What will I watch? | Average watch time and shares per 1,000 views, with total views beside them. |
| What would change my mind? | If the next few similar posts do not hold viewers better, I will look at the topic and audience before making this opening my rule. |
This is stronger than “try a better hook.” You know what the hook is, what will be measured, and what result would make you stop using it.
Check the new post at the same age. Do not rewrite your whole plan after one result. If two or three related posts point the same way, you have a better reason to keep the change. If the evidence is mixed, run a cleaner test.
Comments can supply the next question. If several people ask about shelf size, show it in the next video. If the question sounds like something people would search, our TikTok keyword research guide helps you put it into a clear phrase before you film.
Three sets of numbers that don’t mean the same thing
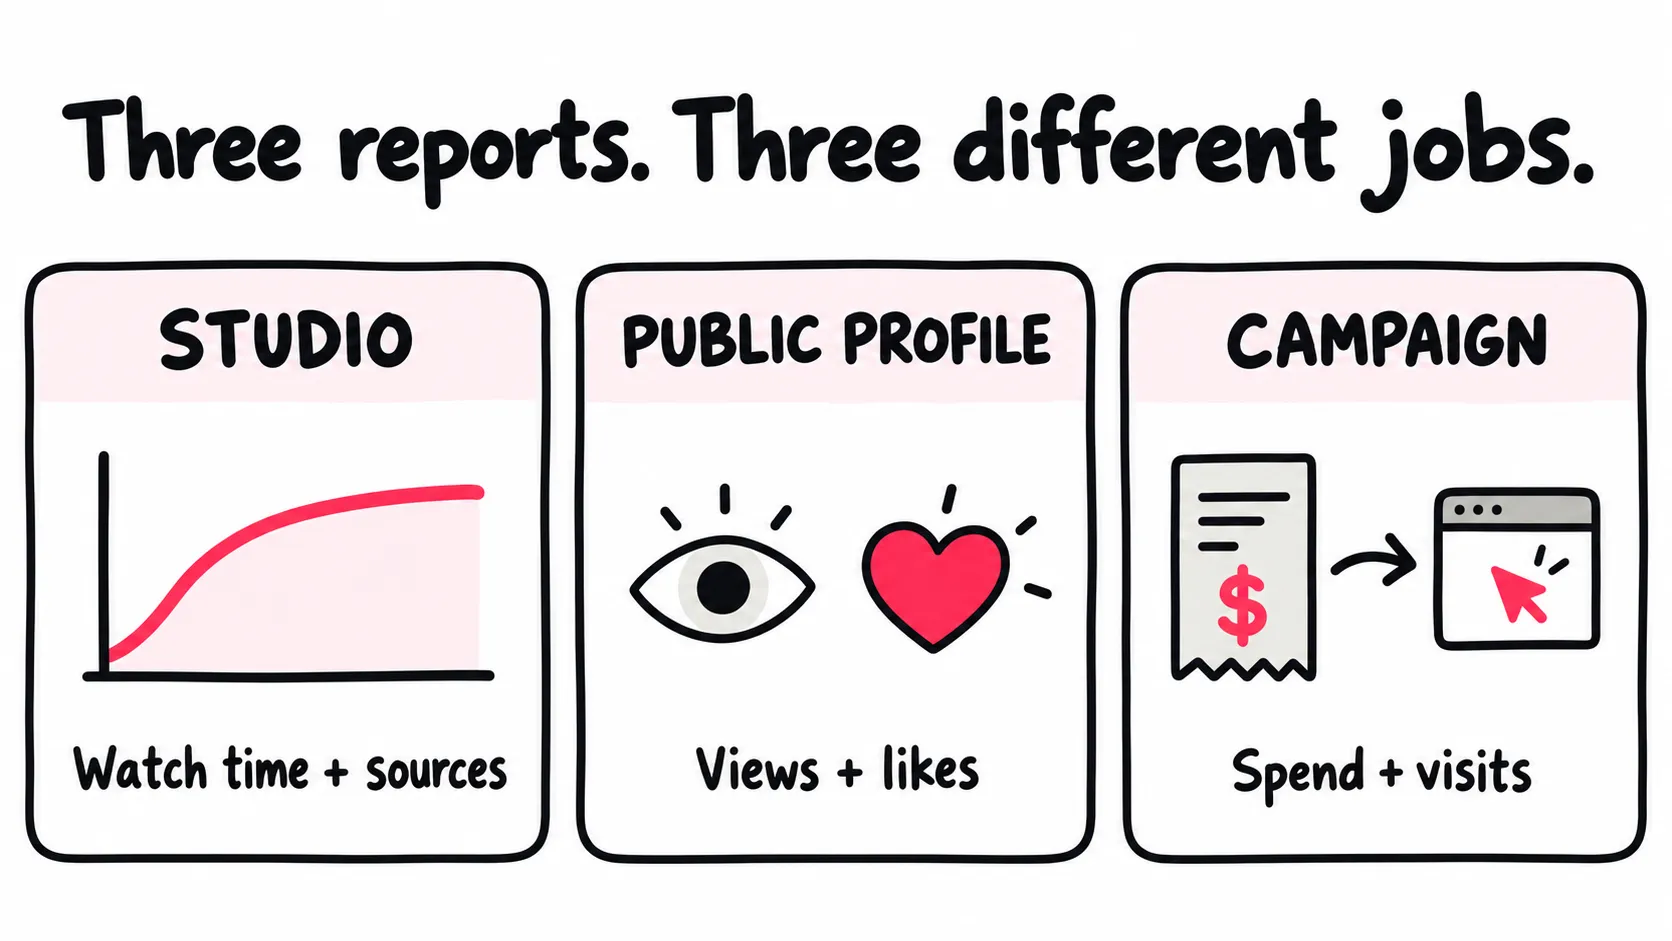
When someone says “TikTok analytics,” they might mean your private Studio report, the numbers anyone can see on a public profile, or a report from a paid campaign. Keep them in three piles.
| Where the number comes from | What you can learn | What it cannot tell you |
|---|---|---|
| Your TikTok Studio | How your own posts did, including watch time and traffic sources when shown | That one number caused a change in reach |
| A public profile check | Visible views, likes, comments, shares, and estimates from recent posts | Someone else’s private watch time, audience, or traffic sources |
| A promotion report | What was spent and what the campaign delivered | That every new view or follow came from that campaign |
A public handle can help you spot patterns in visible posts. A public profile assessment can add that context, but your own watch time and traffic sources still live in Studio. A handle alone cannot reveal another account’s private data.
Once several related posts hold attention and earn the response you want, you face a new question: will people outside your usual audience care too? You could reach them through a search answer, a relevant creator, or paid distribution. Pick the route that fits the viewer and the goal. More views from the same group do not answer the new-audience question.
If you pay to reach new people, keep the campaign report beside your Studio numbers. Say a campaign sends 300 visitors to your video, and over the same week the public count rises by 700 views. That gap is the momentum you want: views beyond what the campaign delivered.
Write down both numbers: 300 visits delivered; public TikTok views rose by 700. Then check the post’s watch time and response in Studio. Keep the post type, audience country, and budget steady across a few launches, so you can see which posts turn paid visits into the strongest response.
If you publish a series, you want a routine you can repeat. Give each included post its own budget and report. Skip the uploads meant only for people who already know you. A system that finds eligible public posts and sends interested visitors from mobile apps and sites lets you keep publishing instead of launching every campaign by hand. TokPromo’s automatic TikTok promotion follows this model.
When your TikTok analytics look wrong
Before you scrap a video idea, check that the report itself makes sense.
| What you see | Check first |
|---|---|
| Analytics or More insights is missing | Open Studio on the web or in its own app. Look for a prompt to turn analytics on. |
| The public count and Studio differ | Check the post and dates. The public count covers the whole life of a post; a Studio chart may cover one week. |
| A traffic source looks tiny | Check the number of views, not just its share of the total. |
| A post stopped reaching people and has a notice | Read the notice. Check account status. TikTok explains who can appeal a post limit. |
If a chart is late, note when you checked it and come back. A blank chart can’t tell you whether your video worked.
Look at posts you can fairly compare. Change one thing. Check the new post at the same age.Frequently asked questions
How do I see my TikTok analytics?
In the TikTok app, open Profile, tap the menu, then choose TikTok Studio and Analytics. To check one post, open it and tap More insights or More data. On a computer, sign in to TikTok Studio.
TikTok says creator tools are available for Personal and Business Accounts. Some sections vary by account, age, region, and device, so use the options shown on yours.
Why are my TikTok analytics not showing or updating?
First check that you are in the right account and date range. In TikTok Studio, look for Get started or Turn on under Analytics. If one post lacks More insights, open Studio on the web or in its separate app and check that post there.
Newer figures can take time to appear. Note when you checked and look again later. If the post has a For You eligibility notice, read it and check your account status. A missing chart alone does not show that your reach was limited.
What does TikTok Analytics track?
TikTok Studio groups account and post results into Overview, Content, Viewers, and Followers. Depending on your account, you may also see LIVE data. Post insights can include views, watch time, full watches, engagement, and where views came from.
Those numbers show what happened on TikTok. They do not prove why a video spread or whether a viewer bought from you. Pick the numbers that match your goal and compare similar posts at the same age.
Are TikTok analytics accurate if the view counts do not match?
A mismatch does not mean either screen is wrong. Check the same post, metric, date range, and time checked. A public video's lifetime count will differ from a Studio chart set to one week. The screens may also refresh at different times.
Save both numbers and check again after the report updates. If the gap remains, send TikTok the post link, screenshots, date ranges, and check times. Do not treat the gap alone as proof of fake or lost views.
Can I see another account’s TikTok analytics?
You can see public counts on another account, such as followers, views, likes, comments, and shares. A public checker can estimate rates from those counts and recent posts.
A handle alone will not show that creator's private Studio watch time, watch graph, traffic sources, or audience data. Check a tool's sample, formula, and update time before using its score to compare creators.