
TikTok Engagement Rate: Find What Works and What to Scale
Calculate your TikTok engagement rate, build fair benchmarks, and spot what averages hide, then use worked examples to pick better content tests.
On this page
What your TikTok engagement rate can hide
Your highest engagement rate may belong to the wrong video to repeat or promote.
A post can win on likes and lose on shares, buyer interest, or total response. Your account average can fall even while each content format improves.
Those details change what you should film next.
What your engagement rate should help you decide
Use your TikTok engagement rate to compare how posts earn a response. Then check what that response is worth for the goal.
Every number in the worked examples is made up. None of them are published TikTok benchmarks.
What You’ll Learn
- Calculate both rates and see what each one hides.
- Build a benchmark from posts worth comparing.
- Find weak spots inside a strong total rate.
- Check later views for a useful response.
- Choose what to repeat, change, or promote.
TikTok engagement rate calculator
Enter counts from one post, captured at the same time. The calculator uses likes + comments + shares. Add followers if you also need the rate by account size.
No login is needed.
By views: (likes + comments + shares) ÷ views × 100.
By followers: (likes + comments + shares) ÷ followers × 100.
Example: 800 likes + 50 comments + 150 shares = 1,000 interactions. That's 5% of 20,000 views or 20% of 5,000 followers.
For several posts, use the combined rate below. Adding a month’s interactions to this tool while entering one post’s views will give you a meaningless result.
How to calculate TikTok engagement rate
TikTok engagement rate by views = (likes + comments + shares) ÷ views × 100.
It measures actions per 100 views, not the share of unique viewers who engaged.
| Method | Formula | Question it answers |
|---|---|---|
| By views | Interactions ÷ views × 100 | How much response did these views produce? |
| By followers | Interactions ÷ followers × 100 | How much response did the post earn relative to account size? |
| Like, comment, or share rate | That action ÷ views × 100 | Which kind of response did it earn? |
A post with 420 likes, 30 comments and 50 shares has 500 interactions. With 10,000 views and 2,000 followers, its rate is 5% by views or 25% by followers.
Neither is wrong. They answer different questions. One person can take several actions, and people who don’t follow you can engage.
Why follower rates can hide a weaker response
For the same post and counts, this relationship holds:
Rate by followers = rate by views × (views ÷ followers).
Take an account with 2,000 followers. A post with 10,000 views at 5% earns 500 interactions, or 25% by followers.
Another with 20,000 views at 3% earns 600 interactions, or 30% by followers.
The follower rate improved, but the response per view fell.
The extra views drove that increase, so a follower rate alone is a poor way to judge whether a new hook, format, or offer worked better.
Keep the inputs consistent
Use TikTok Studio’s post analytics to capture counts where available. Record the post age, check time, full counts, and whether it had paid support. Our guide to reading TikTok analytics shows which report holds each count.
Rounded labels such as “1.2K” limit how precise your answer can be.
Count saves separately unless the benchmark includes them. Mark missing data as missing. Zero shares and an unknown share count are different facts.
Use the same period for both parts of the formula.
Lifetime likes need lifetime views. This month’s likes need this month’s views from the same posts.
What is a good TikTok engagement rate?
A useful target beats the normal range for comparable posts and supports the post’s goal.
A raw 5% cannot tell you that. You need the formula, post type, age, and source of the views before calling it strong or weak.
Outside benchmarks help only when their methods fit yours. Check whether the sample covers brands or creators, account sizes, paid posts, saves, and which dates.
Also check whether the reported average gives each post or each account equal weight.
Build a benchmark that can guide a decision
Start with roughly 10 to 20 recent posts in one repeatable format. That’s a working sample, not a magic threshold.
Use fewer if that’s all you have, but treat the result as early evidence.
Match the topic, purpose, and rough length. Keep sponsored work and paid reach labeled.
Capture each post at a fixed age, such as seven days, so older posts don’t get an unfair head start.
Track two numbers:
- Median: the middle post rate, found with
MEDIAN. - Middle range: where the middle half of rates land, found with
QUARTILE.INC.
The range shows how much typical results vary. The median alone cannot.
| Example benchmark for one format | Rate by views |
|---|---|
| Lower edge of the middle half | 3% |
| Median | 4% |
| Upper edge of the middle half | 5% |
A new post at 4.3% sits inside normal spread. At 6%, it deserves a closer review. Neither result proves a change worked.
Compare its shares, comments, views, and audience fit before making more of it.
Don’t remove a weak post just because it hurts the average.
Exclude posts only for a clear reason, such as paid support or a different format, and apply the same rule to strong posts.
Catch an average that falls while both formats improve
Suppose you publish tutorials and short skits. Your combined rate changes with how much of your traffic each format gets.
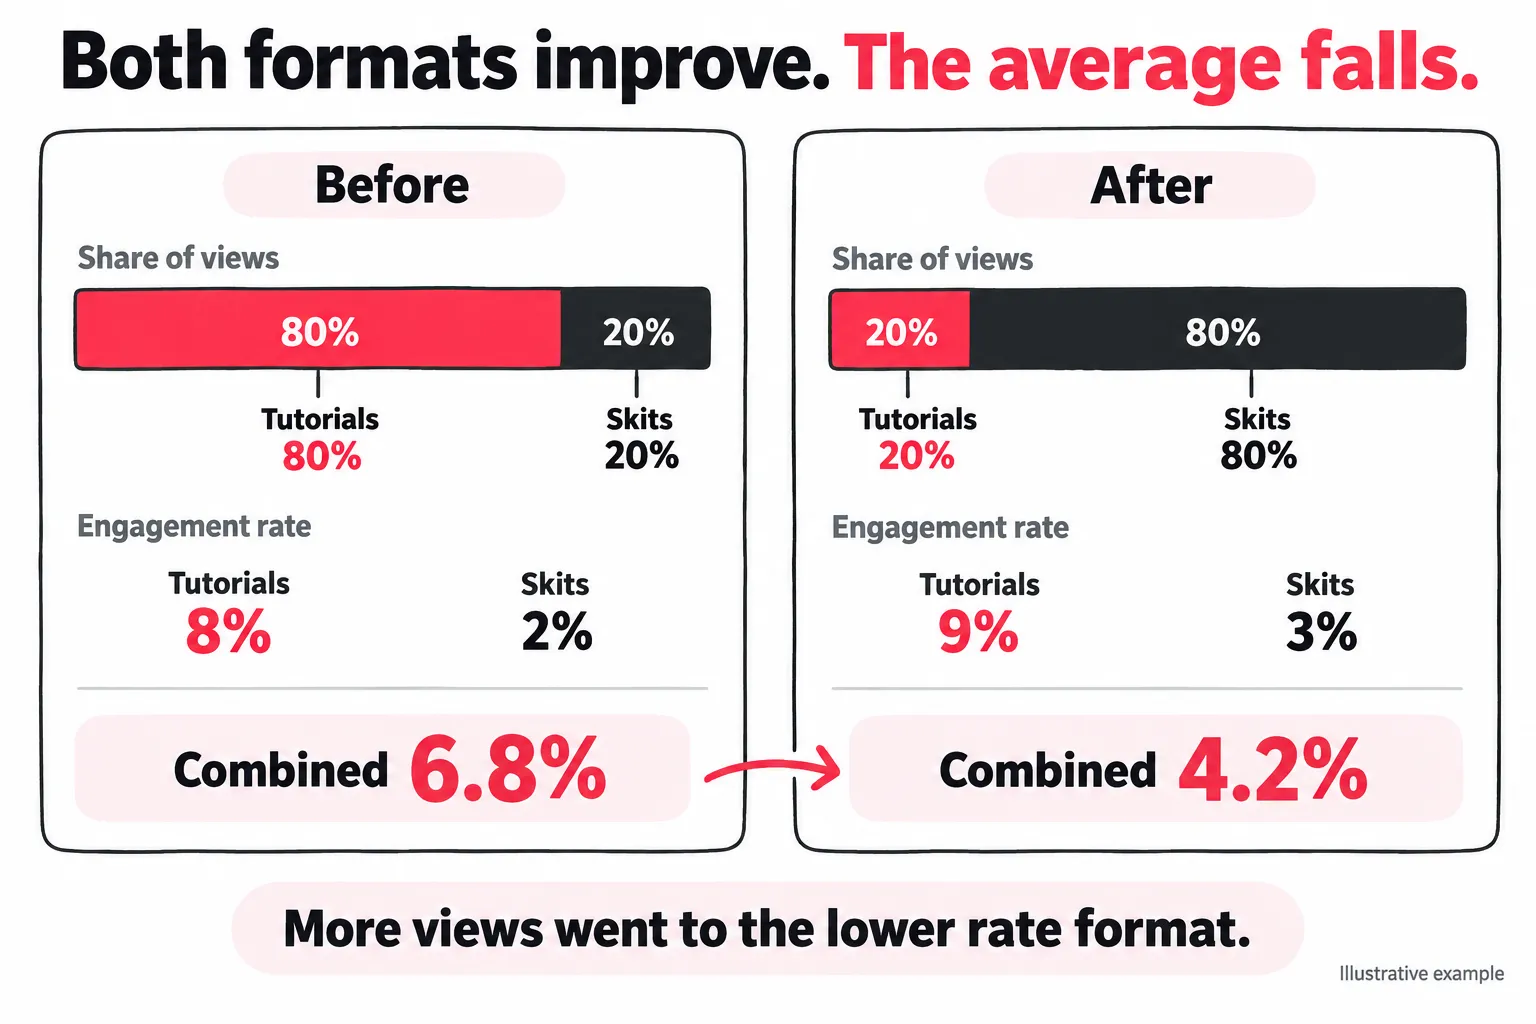
| Format | First period: views / rate | Next period: views / rate |
|---|---|---|
| Tutorials | 8,000 / 8% | 2,000 / 9% |
| Skits | 2,000 / 2% | 8,000 / 3% |
| Combined | 10,000 / 6.8% | 10,000 / 4.2% |
The next step is to check why your mix changed and whether skits serve a useful goal. Rewriting all your tutorials to fix the account average would miss the cause.
How to calculate average TikTok engagement across posts
Use total interactions ÷ total views × 100 for the response across all views.
Use a median post rate to describe a typical post. These numbers serve different jobs.
| Example post | Views | Interactions | Rate by views |
|---|---|---|---|
| Small tutorial | 1,000 | 100 | 10% |
| Broad topic video | 9,000 | 180 | 2% |
| Combined | 10,000 | 280 | 2.8% |
- Mean post rate: 6%. Each post gets equal weight.
- Combined rate: 2.8%. Each view gets equal weight.
For this two post sample, the median also happens to be 6%.
Don’t switch methods between reports.
A tool using a mean can look much better than one using a combined rate even with the same posts.
For an average post rate by followers, divide total interactions by the post count first. Ten posts with 5,000 interactions and 2,000 followers give:
5,000 ÷ 10 ÷ 2,000 × 100 = 25%.
Without the post count, you’d report 250%. Also state when you captured followers.
A fast growing account measured against today’s follower count can look weaker than the same posts measured against the count when they went live.
What to put in a media kit
Give a brand enough context to price the opportunity, not just admire a percentage. Use its requested formula and show the sample behind it.
Include median views, audience fit, and relevant sponsored work when you have it.
A useful method note looks like this:
Sample: 12 organic tutorials, each measured at seven days.
Formula: total likes, comments and shares ÷ total views × 100. Saves excluded.
Also reported: median views and median post engagement rate.
Dates: [start] to [end].
If all you have is lifetime data, label that instead. Don’t present a few selected winners as your normal result. List standout work separately, with a clear reason it fits the brand.
Read the engagement mix before choosing a winner
Two posts with a 5% rate can have very different value.
Break the total into likes, comments and shares before deciding what to repeat.
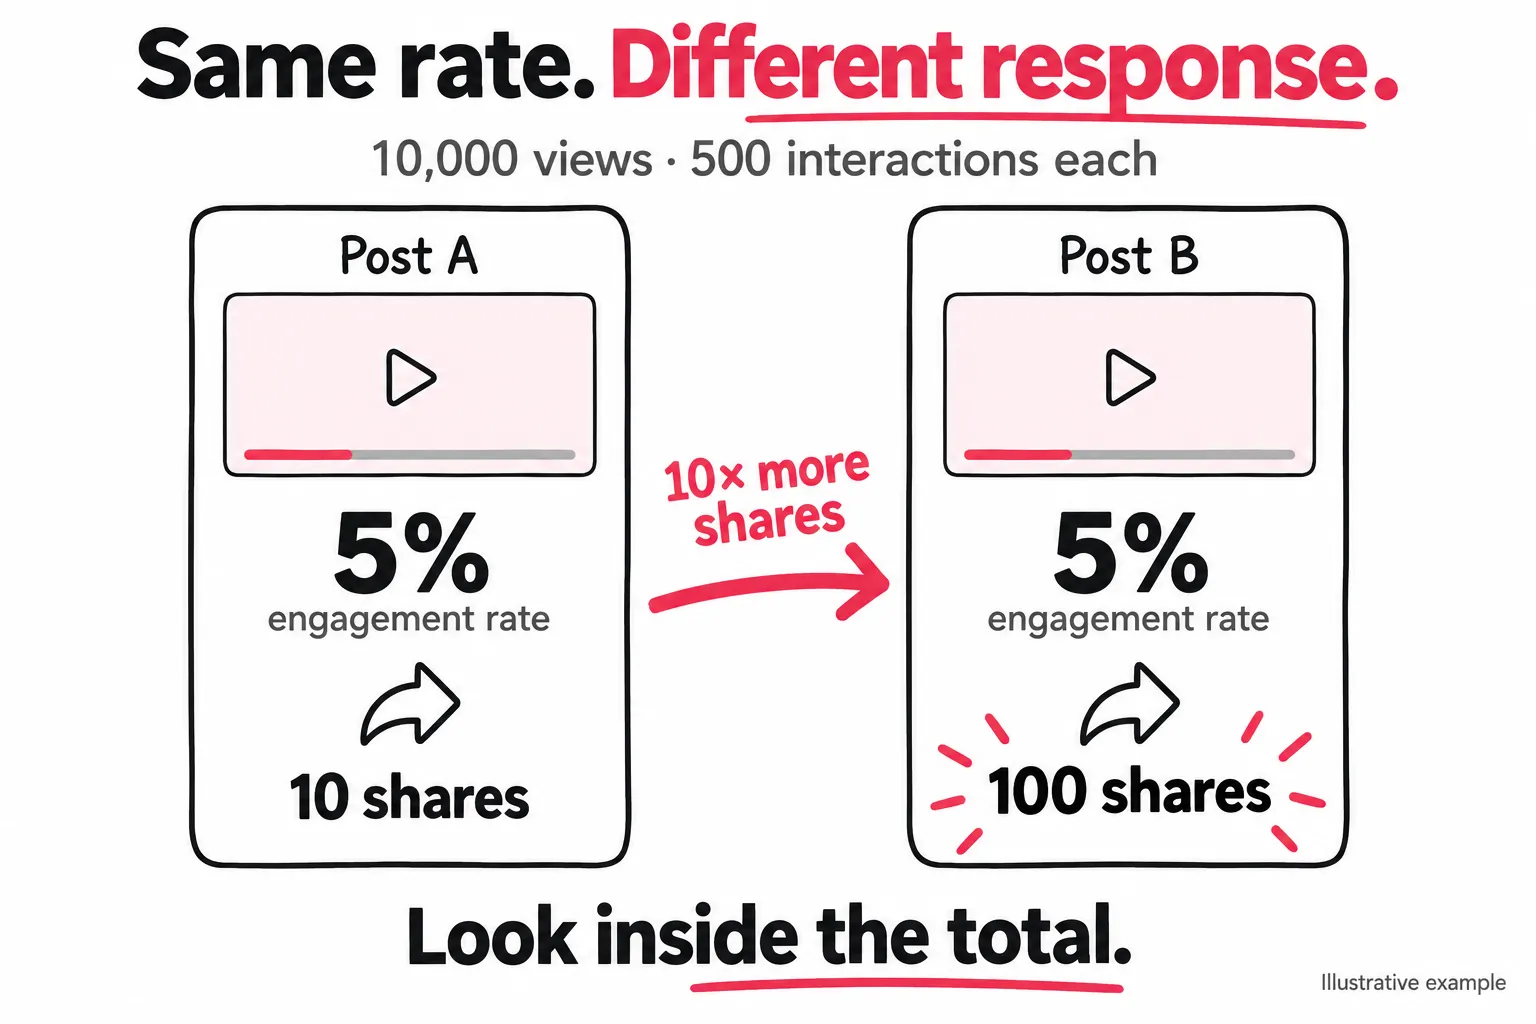
| Metric | Post A | Post B |
|---|---|---|
| Views | 10,000 | 10,000 |
| Likes | 470 | 300 |
| Comments | 20 | 100 |
| Shares | 10 | 100 |
| Total engagement rate | 5% | 5% |
| Shares per 1,000 views | 1 | 10 |
If your goal is to make content people pass on, B is the stronger candidate. It earned ten times the shares per view.
But read its comments: useful questions, complaints, and arguments can all raise the same total.
For small rates, use actions per 1,000 views = actions ÷ views × 1,000. It’s easier to compare 10 shares with 1 share than scan 1% beside 0.1%.
Keep that unit clear in your sheet.
Match the signal to the job
| Post’s job | Response to inspect | What could fool you |
|---|---|---|
| Teach a process | Saves, shares, questions about applying it | Saves don’t prove anyone used the advice |
| Start a useful discussion | Specific viewer comments and follow up questions | Your own replies or one argument can inflate the count |
| Build demand | Questions about fit, price, stock, or the next step | Interest in comments is not a sale |
| Reach more relevant people | Shares alongside total views and audience fit | People can share a post to criticize it |
There’s no need to invent a score that makes a share worth five likes. Unless you’ve tested that link to an outcome, the weight is just a guess.
Keep the standard rate, then report the action tied to your goal beside it.
Read a fixed sample of comments in the same way each time. Tag them as questions, intent, praise, confusion, or unrelated replies.
Keep your own replies separate. TikTok comment insights can help where available, but check the actual wording.
If comments vanish or seem oddly scarce, check comment permissions and filters first. A settings issue needs a different fix from a weak prompt.
Is a falling engagement rate a problem? Check the added views
A lifetime rate blends early and later response. To see what happened as views grew, capture the same post twice and compare the changes.
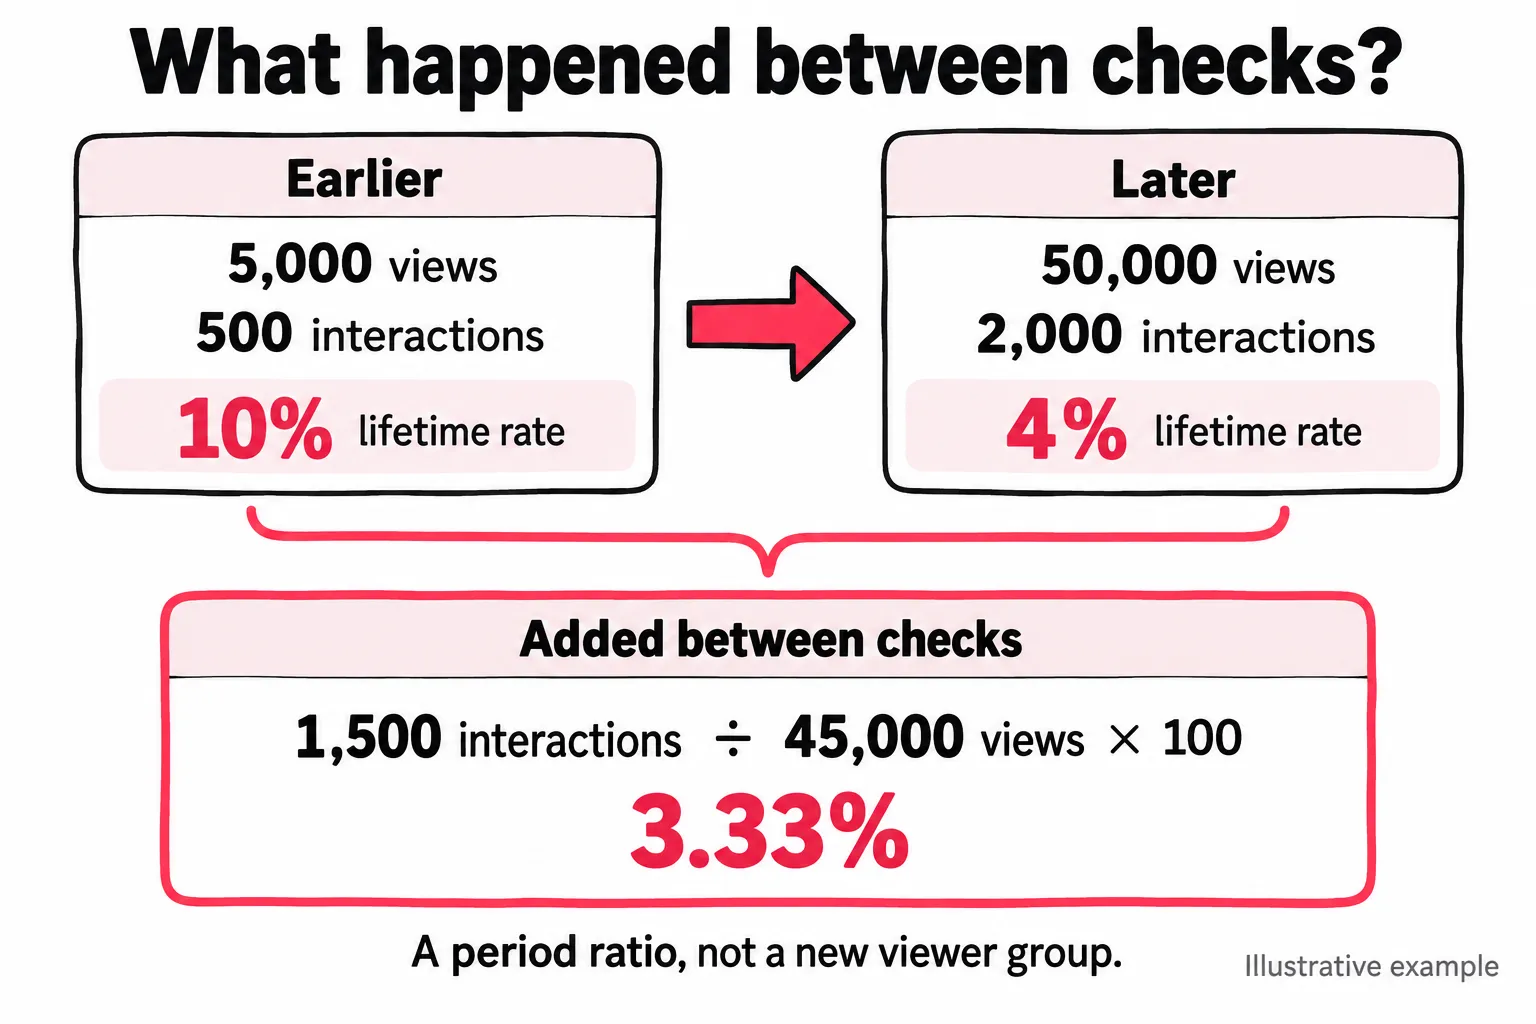
| Checkpoint | Views | Interactions | Rate by views |
|---|---|---|---|
| Earlier | 5,000 | 500 | 10% |
| Later | 50,000 | 2,000 | 4% |
| Added between checks | 45,000 | 1,500 | 3.33% |
The lifetime rate fell, but the post earned four times the total interactions. Between checks, it gained 1,500 interactions and 45,000 views:
Rate between checks = added interactions ÷ added views × 100.
The added counts give 3.33%. That shows the response during that period, which the earlier 10% no longer describes.
It is not a rate for a distinct group of new viewers.
Someone who watched earlier may comment later. Counts can also update at different times. Use this as a tracking signal, not proof of who responded or why.
Did the extra response serve the goal?
- Shares and useful inquiries grew: a lower rate may be a fair trade for scale.
- Views grew, but useful actions stalled: check the audience and content before adding more reach.
For a small post, show raw counts beside every rate. A change from two shares to four is a 100% lift, but only two extra actions.
There’s no universal view count at which a result becomes reliable.
If the issue is lost reach, use the separate guide to diagnosing TikTok views dropping. If views are strong but audience growth is weak, check why views aren’t turning into followers.
How to improve TikTok engagement rate with a test worth running
Choose one weak signal, one plausible cause, and one change that tests it.
“Improve engagement” is too broad to tell you what to film or whether it worked.
Likes hold up, but shares lag
The advice may be pleasant but hard to pass on.
- Test: replace broad tips with one checklist for a specific use.
- Check: did people stay long enough to see it?
Comments repeat the same basic question
A needed step may be missing.
- Test: show that step on screen.
- Check: did confusion fall? Fewer comments can mean a better explanation.
Comments rise, but useful questions fall
The prompt may draw debate more than interest.
- Test: ask about a real choice your viewer faces.
- Check: did the right people join in?
Saves rise, but action stays weak
The post may be useful later without giving viewers a next step.
- Test: show when and how to use the advice.
- Check: did relevant inquiries grow too?
Treat these as causes to test. A percentage can’t diagnose the problem. If the topic is too broad, TikTok keyword research can help narrow the question before you change the format.
Write the decision rule before you post
Suppose your tutorial share rate is usually four per 1,000 views, with a middle range of three to five.
You want to test whether showing the finished result first helps people see why the tutorial is worth sharing.
Change: show the finished result in the opening.
Keep similar: topic, length and paid status.
Review point: seven days after each post.
Main signal: shares per 1,000 views.
Check for a tradeoff: total shares and watch time.
Repeat: several comparable tutorials before keeping the change.
If several posts move beyond the usual share range without a clear loss in watch time or total shares, keep testing that opening.
If one wins and the rest sit near baseline, you don’t yet have a repeatable result.
If possible, mix some unchanged posts into the same period. That helps reveal a week when all posts did better. It still isn’t a controlled experiment: the videos and viewers differ.
Choose the review point in advance. Don’t declare a win the first hour the rate looks good.
Add this test to your weekly growth review so the finding changes what you make next.
TikTok’s recommendation guidance includes watching and skipping as well as interactions. There is no published engagement rate in that guidance that guarantees more distribution.
How to test engagement beyond your usual reach
Once a format earns useful responses, ask: does that response hold up with more reach? Your organic rate gives you a baseline for a planned test. To see that baseline next to your goals and posting habits, run the free TikTok profile analyzer.
Choose the posts to match the question:
- Extend one winner’s reach: start with that video.
- Test a repeatable format: choose a batch in advance. Selecting only early winners tells you little about the format’s usual result.
Give comparable posts comparable support
For your next four similar tutorials, set three rules before posting:
- Spend: choose a budget per post and a total limit you can afford.
- Setup: keep the target country and launch timing as close as possible. Record changes in placements or audience.
- Review: compare posts at the same age, with a clear reason to pause.
Equal spend per post gives you a fair comparison of response and cost across videos.
Automatic post detection and a separate campaign per upload remove repeated link submissions and campaign setup. Your test depends less on whether you had time to launch it that day.
This automatic launch process shows how the steps fit together. Keep the eligibility and spending rules in your hands.
Automate the setup. Keep control of the decision.Separate delivery from response
Mobile ad placements bring people from other apps and sites to the original TikTok post, where they can watch, share, and comment while the video is fresh.
Keep two records:
- Delivery: where the ad ran, what it cost, and the traffic it reported.
- Response: TikTok views, shares, comments, and the actions tied to your goal.
Capture starting counts when available.
If support starts first, mark that gap. Your first recorded counts may already include paid response.
Inside TikTok, Spark Ads add paid interactions to the original post, so public totals can include paid response.
Check ad video metric definitions too. A video start and a focused view measure different things.
For outside placements, an ad click is not a TikTok interaction. Keep it out of this formula.
Use each report to improve the next test
Keep separate campaign and post reports, with one record per video. Review them in this order:
- Check the traffic measure. What does the reported number actually count?
- Check useful response. Did shares, relevant questions, or the action you chose grow?
- Check cost. Judge cost per result alongside engagement.
- Choose the next step. Repeat, adjust, or pause. Record why.
Over several launches, the reports show which sources send people who respond. Shift budget toward them, and later launches get sharper.
Over several uploads, you learn which content earns a response and which delivery choices deserve another test. You stop starting each campaign with the same unanswered questions.
A lower rate can be worth it when total response grows at a cost you accept.
For channel choice, compare promotion methods. For a first test inside TikTok, see when Promote is worth using.
Frequently asked questions
Should I calculate TikTok engagement rate using followers or views?
Use views to compare post response. Use followers when a brand or report requests that formula. The follower rate can rise because views grew, even when response per view fell. Always label the method.
Why does my TikTok engagement rate come out above 100%?
A follower rate can exceed 100%. People outside your follower base can engage, and one person can take several actions. For an average post rate, divide total interactions by the post count before dividing by followers. Neither formula measures unique people.
Which engagement rate should I put in my TikTok media kit?
Use the brand's requested formula, with median views and the sample behind the rate. Include post count, type, dates, audience fit, and paid status. State whether counts cover each post's full life or a fixed age.
Show relevant sponsored results separately when you have enough for a useful comparison.
Why do I have a high like ratio but only a few hundred views?
A strong like rate describes the views you got. It doesn't prove a wider audience will respond the same way. Compare watch time, completion and shares with similar posts. Read the comments for audience fit. Small samples can make a rate look strong.
Do views, watch time and ad clicks count as TikTok engagement?
This formula counts likes, comments and shares, divided by views. Track saves separately unless your comparison includes them. Watch time, ad clicks and sales answer other questions. An ad click from another app must not be added to TikTok interactions.